- Home
- Hardware
- SDKs
- Cloud
- Solutions
- Support
- Ecosystem
- Company
- Contact
news
The Latest Features of ESP Insights
Shanghai, China
Jan 28, 2022
The new version of ESP Insights supports Group Analytics, and HTTP (in addition to MQTT) as the transport.
ESP Insights is a device observability framework that allows developers to remotely peek into their firmware and get detailed information about its execution. This way they can analyze it and pinpoint any issues on time. The beta version of ESP Insights was released in July 2021 and has been actively used by the ESP developer community ever since. The latest version of ESP Insights includes:
- Support for HTTPs/REST API-based device communication
- Group Analytics

Let’s look at these new features in more detail:
HTTPS Transport
When we launched ESP Insights, we borrowed some concepts from the ESP RainMaker, i.e. “Claiming”, and used MQTT as the transport method connecting RainMaker and Insights. However, for applications that only need to use ESP Insights without ESP RainMaker, the “Claiming” concept is an unnecessary step. So, we now support HTTPs/REST API-based Insights communication, as well. Thus, instead of using unique X.509 key-certificate pairs, a single HTTP API key can now be used by multiple nodes, thereby simplifying the setup and management of devices. (Note that, due to the always-on connectivity of MQTT, some of the features that we will introduce in the future may be more optimised for MQTT-based transport.)
Enabling Insights with HTTPS
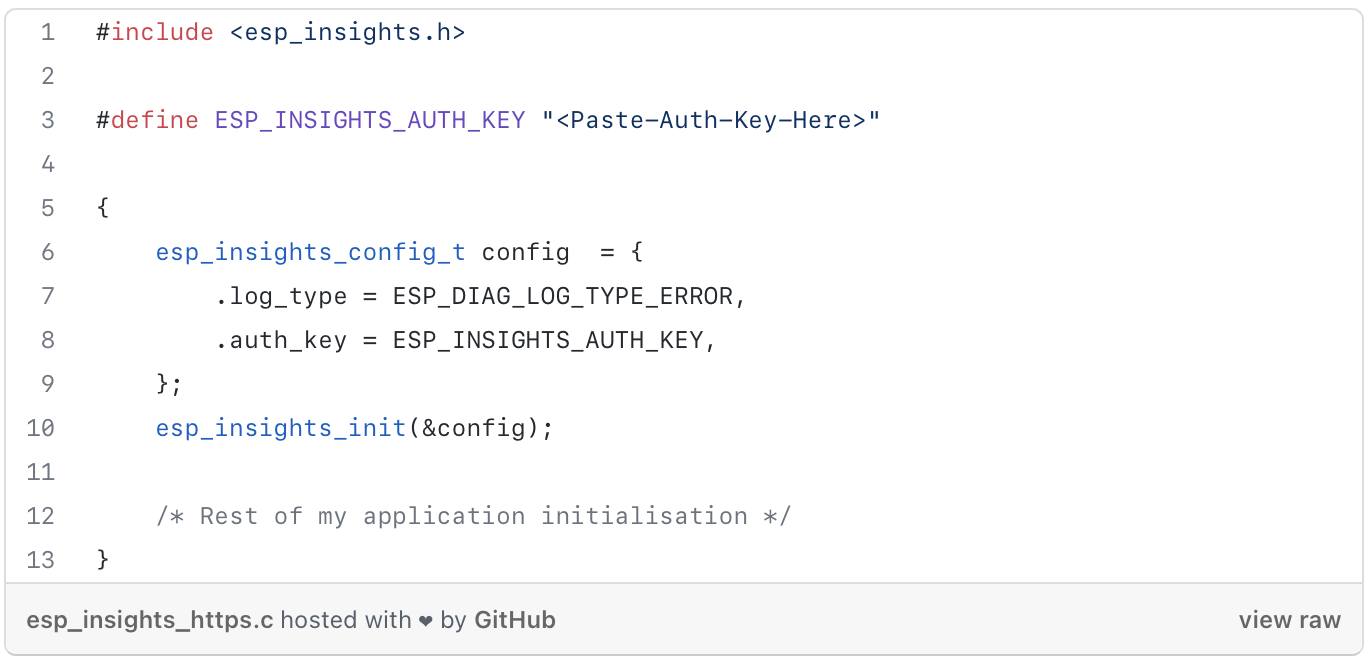
Enabling ESP Insights in your firmware is now as easy as adding the following lines of code to your application:

With this code, your application can start reporting ESP-Insights data to the Insights Cloud. As you may have noticed, all you need is the unique ESP_INSIGHTS_AUTH_KEY to be embedded in your firmware. Here is how you can obtain the ESP Insights Auth Key:
- Sign up or sign in on the ESP Insights Dashboard.
- Visit the “Manage Auth Keys” and generate an “Auth Key”.
- Copy the “Auth Key” to your firmware.
Once the device boots up, you should look for the following logs that contain the Node ID:

You may use this Node ID for monitoring node logs, crashes, reboots, metrics, and variables, through the ESP Insights Dashboard. For more details, please read our getting-started guide.
Group Analytics
So far, ESP Insights has supported diagnostics at the node level, thus reporting any abnormal events, metrics, and values of point-in-time variables for individual nodes. The latest version of ESP Insights, however, introduces group analytics, which provides insights into how device groups are performing. This enables users to:
- Group devices according to different categories, such as Project, Project Versions or Event categories;
- Compare firmware insights across different versions of a project;
- Drill down to an event category, while having started from very high-level insights at the project level.

Here are a few examples of group-based data that can be observed:
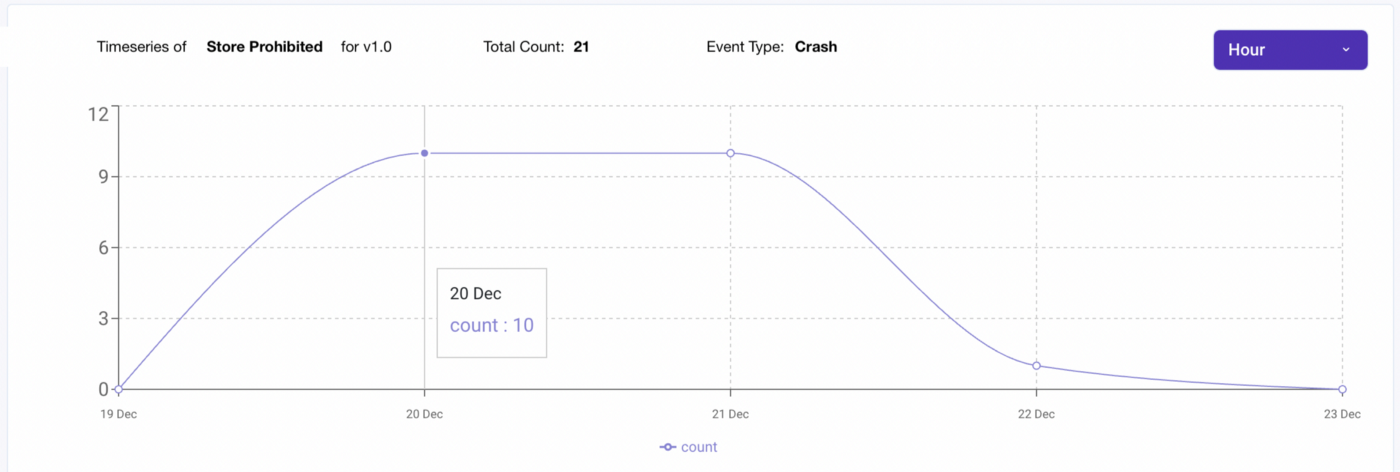
- Counts, grouped by events (e.g., “errors”), in a particular project or version, at a selected time frame, ranging from hourly, to weekly or monthly ones.

- Distribution of event-counts (e.g., “crash counts”) within a group during a selected time frame.

- The distribution of event-counts (e.g. Reboot reason) can be drilled further down, in order to reveal the nodes reporting the particular event.

- Count of unique nodes reporting certain events (reboots / errors / warnings) during a selected time frame.

- The list of top nodes having the greatest number of events can be drilled down to the category level.
Watch this space for all the new, exciting features of ESP Insights which are soon to be announced!


 LinkedIn
 微信
微信
 Twitter
 Facebook
